Search notes:
R package oce: binAverage
binAverage(x, y, xmin, xmax, xinc)
binAverage can be used to get the average of data in bins.
Demonstration with an example:
library(oce)
X11()
x <- c( 13.1 , 16.2 , 12.9 , 28.7 , 25.4 , 31.5 , 36.5 , 33.3 ,
11.8 , 17.6 , 26.4 , 21.3 , 38.3 , 37.4 , 31.5 )
y <- c( 1 , 3 , 6 , 5 , 9 , 12 , 10 , 11 ,
5 , 8 , 11 , 7 , 9 , 8 , 9 )
stopifnot(length(x) == length(y))
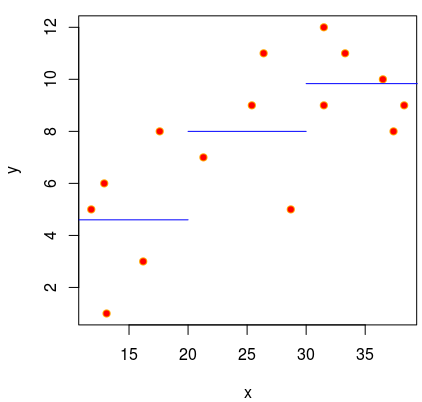
plot(x=x, y=y, bg='red', col='orange', pch=21)
avg <- binAverage(x, y, xmin=10, xmax=40, xinc=10)
lines( c(10, 20), c(avg$y[1], avg$y[1]), col='blue')
lines( c(20, 30), c(avg$y[2], avg$y[2]), col='blue')
lines( c(30, 40), c(avg$y[3], avg$y[3]), col='blue')
# Wait for mouse click
invisible(locator(1))
sum(y[x<20]) / length(y[x<20])
# [1] 4.6
avg$y[1]
# [1] 4.6
sum(y[x>20 & x<30]) / length(y[x>20 & x<30])
# [1] 8
avg$y[2]
# [1] 8
sum(y[x>30 & x<40]) / length(y[x>30 & x<40])
# [1] 9.833333
avg$y[3]
# [1] 9.833333
The plot produces: