moonAngle-illuminatedFraction-phase.R
The following R script plots the moon phase and the moon's illuminated fraction for a period of 75 days:
library(oce)

X11()

Sys.setlocale("LC_TIME", "en_US.UTF-8")

t_start <- as.POSIXct("2017-02-23", tz='UTC')
t_end   <- t_start + 75 * 24 * 3600  # 75 days

tm <- seq(from = t_start,
           to  = t_end,
           by  = 10000
        )

moon     <- moonAngle(t=tm, longitude=-8, latitude=47)
fraction <- moon$illuminatedFraction
phase    <- moon$phase - floor(moon$phase)

plot (tm, fraction, type="l", col='blue', xlab='', ylab='')
lines(tm, phase   , type="l", col='red' )

grid()

# wait for mouse click or enter pressed
locator(1)
Github repository about-r, path: /packages/oce/moonAngle-illuminatedFraction-phase.R
This is the resulting image: 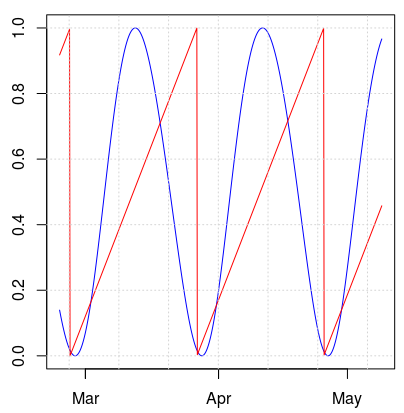
The plot was inspired by this r-bloggers.com article.
See also my question on stackexchange.