R data visualization: bar chart for mean (average) of bins/groups
The following example first creates two vectors: x and y.
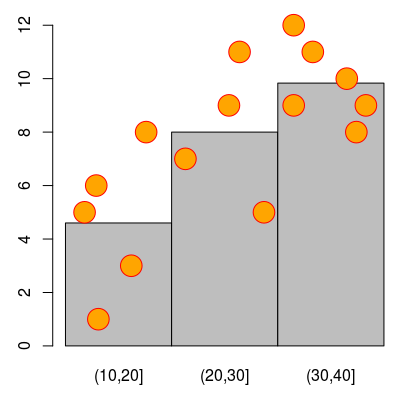
Using cut, three groups are created. The first group is for x between 10 and 20, the second group for x between 20 and 30 and the third group for x between 30 and forty. Each element in bins stores to which group each element in x belongs.
bins is then used in tapply to calculate the mean for each group's y elements. The result is stored in mean_.
barplot creates a bar chart whose bars' heights correspond to the mean of each group.