Search notes:
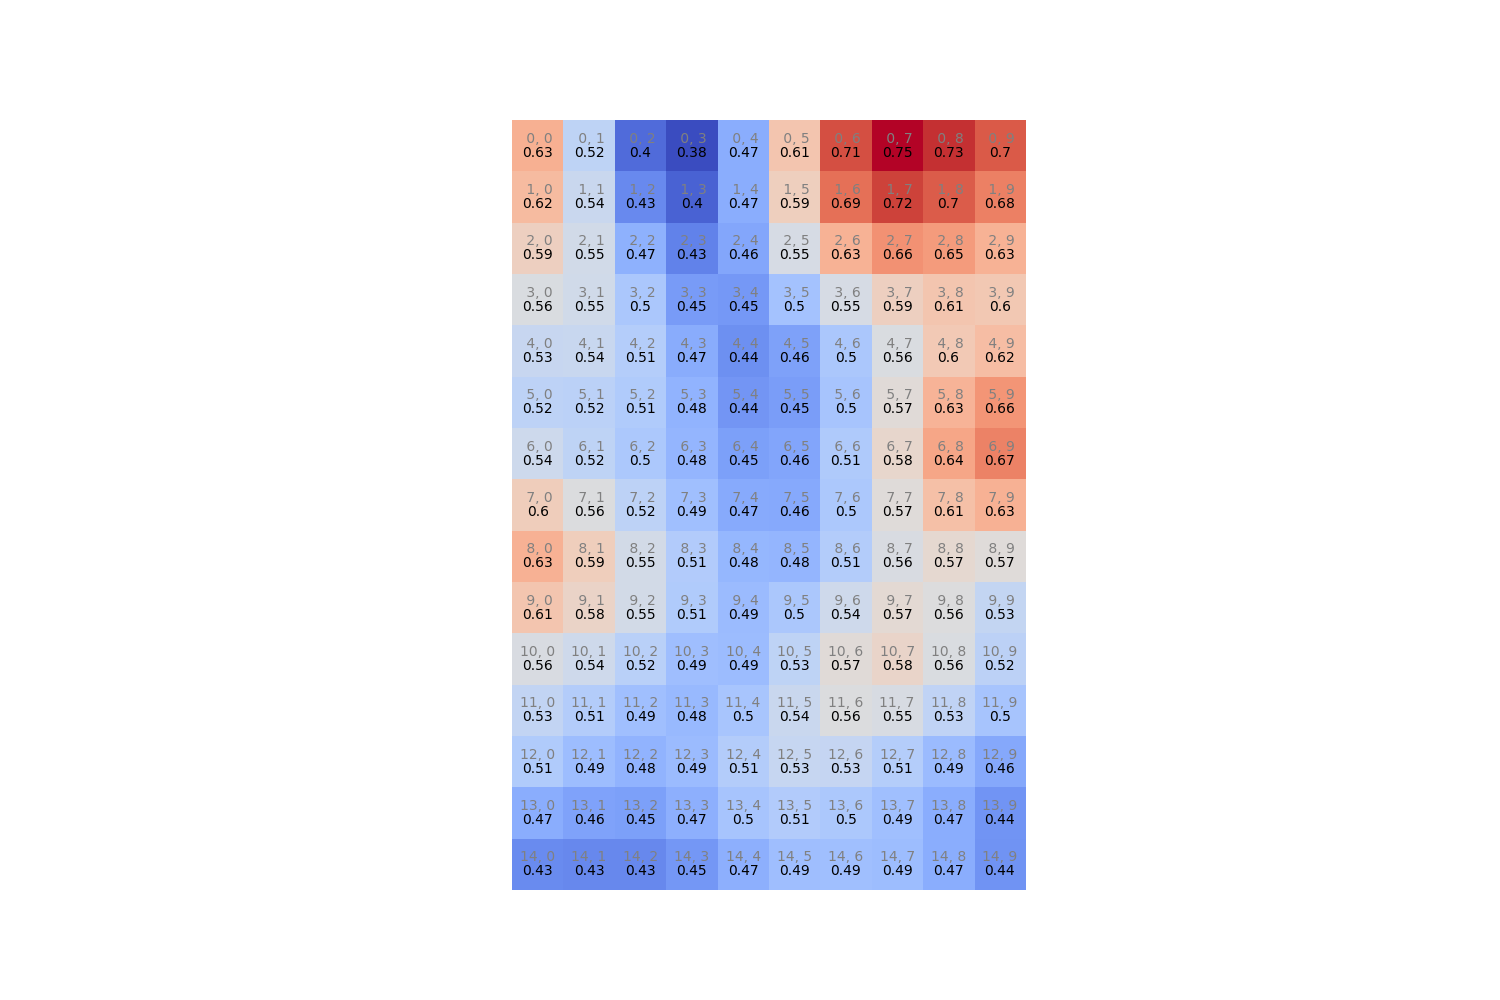
Python matplotlib example: Heat map
import matplotlib.pyplot  as plt
import numpy              as np
from   scipy.ndimage import gaussian_filter

width  = 15
height = 10

np.random.seed(12345)

values = np.random.rand(width, height)
values = gaussian_filter(values, sigma=1.4)

plt.figure(figsize=(width, height))
plt.imshow(values, cmap = 'coolwarm')

for  x in range(width ):
 for y in range(height):

     plt.text(y, x, f'{x:>2},{y:>2}'           , ha = 'center', va = 'bottom', color='gray' )
     plt.text(y, x, round(values[x,y].item(),2), ha = 'center', va = 'top'   , color='black')

plt.axis('off')
# plt.show()
plt.savefig('img/heat-map.png')