Installation
The following attempt to install matplotlib …
$ python3 -m pip install -U matplotlib
… resulted in these warnings:
WARNING: The scripts f2py, f2py3 and f2py3.9 are installed in '/home/rene/.local/bin' which is not on PATH.
Consider adding this directory to PATH or, if you prefer to suppress this warning, use --no-warn-script-location.
WARNING: The scripts fonttools, pyftmerge, pyftsubset and ttx are installed in '/home/rene/.local/bin' which is not on PATH.
Consider adding this directory to PATH or, if you prefer to suppress this warning, use --no-warn-script-location.
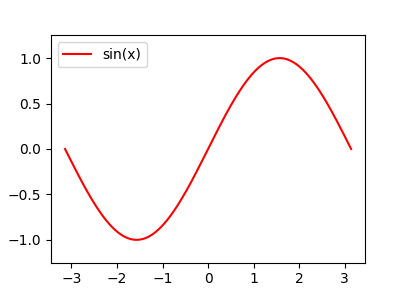
Plotting a simple graph
import numpy as np
import matplotlib.pyplot as plt

x = np.linspace(-np.pi, np.pi, 300)
y = np.sin(x)

plt.plot(x , y, 'r-', label='sin(x)') # r- draws a red line
plt.ylim(-1.25, 1.25)
plt.legend()
plt.show()
TODO
matplotlib.pyplot is a collection of functions that make matplotlib work like MATLAB.
Data to be plotted is expected to be provided as numpy.array or numpy.ma.masked_array objects, or objects that can be passed to numpy.asarray().
There are two
interfaces:
- Object oriented style (also refered to as explicit interface)
- Implicit (modeled on MATLAB)
When using the OO style (?):
Matplotlib accepts TeX equation expressions in any text expression.
Axes class
The
Axes class is central to matplotlib because it defines the plotting area for data to be drawn.
Standard use
import matplotlib.pyplot as plt
import numpy             as np

#
#     Create a figure …
#
fig = plt.figure()

#
#     … use the figure to create one or more axes …
#
ax  = fig.add_subplot(2, 1, 1) # two rows, one column, first plot

#
#    … and use the axes to create the Artist primitives.
#

ax.…()

fig.show()
plt.waitforbuttonpress() # Really necessary?
Variant: create figure and axes in one go:
fig, ax = plt.subplots()
Coordinates
The default coordinate system for figures: 0,0 is bottom-left, 1,1 is top-right.
The coordinate system can be changed by setting the
transform property of an
Artist object.
See also the
transFigure property of the
Figure object.
styles/rcParams
Plots can be styled using
rcParams. rcParams can be set using the following methods, in order of decreasing precedence:
- Setting
matplotlib.rcParams at runtime
- Using style sheets
- Using a matplotlibrc file
Available styles can be found with
print(plt.style.available)