Search notes:
Python matplotlib example: MNIST character
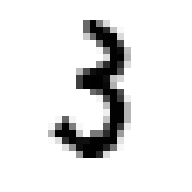
The following
matplotlib example tries to demonstrate how a character of the
MNIST database can be drawn:
import tensorflow as tf
import matplotlib.pyplot as plt

(x_train, y_train), (x_test, y_test) = tf.keras.datasets.mnist.load_data()

image = x_train[1234]

fig = plt.figure(figsize=(1, 1))

#
# change 'gray_r' to 'gray' for white-on-black image
#
plt.imshow(image, cmap='gray_r')

plt.axis('off')
plt.savefig('img/MNIST-character.png', bbox_inches='tight', pad_inches=0, dpi=250)
# plt.show()
When executed, the following image is produced:


