Search notes:
Python matplotlib example: MNIST character grid
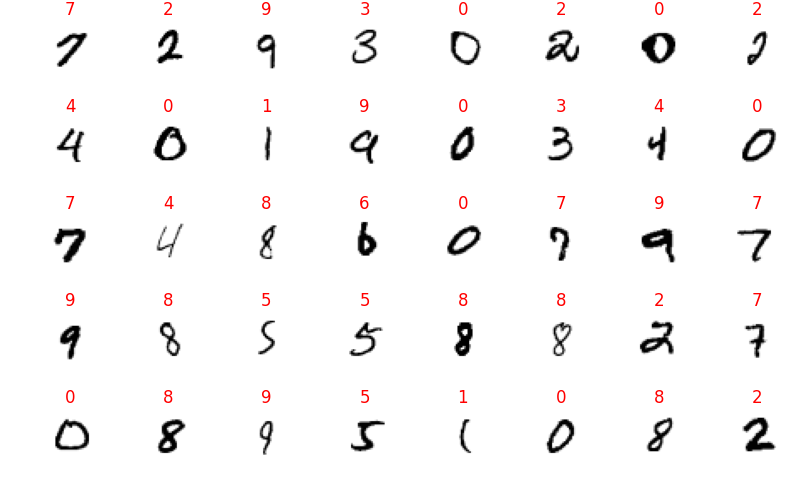
The following example displays
elems_y rows of
elems_x MNIST characters in a grid.
import tensorflow as tf
import matplotlib.pyplot as plt
import numpy as np

(x, y), (xt, yt) = tf.keras.datasets.mnist.load_data()

elems_y = 5
elems_x = 8

fig, axes = plt.subplots(elems_y, elems_x, figsize=(elems_x, elems_y))
# fig.tight_layout(pad=0.1)
fig.tight_layout()

imIxs = np.random.choice(range(len(x)), elems_x * elems_y, replace = False)
for ax, imIx in zip(axes.flat, imIxs):

    ax.imshow(x[imIx] , cmap='gray_r')
    ax.set_title(y[imIx], color='red')

  #
  # Use following line to also include image number (index)
  #
  # ax.set_title(f'{y[imIx]} ({imIx})', color='red')

    ax.set_axis_off()


plt.savefig('img/MNIST-character-grid.png')
When executed, the following image is produced: