Search notes:
R: ggplot2 - heatmap
library(ggplot2 );
library(reshape2); # for melt()
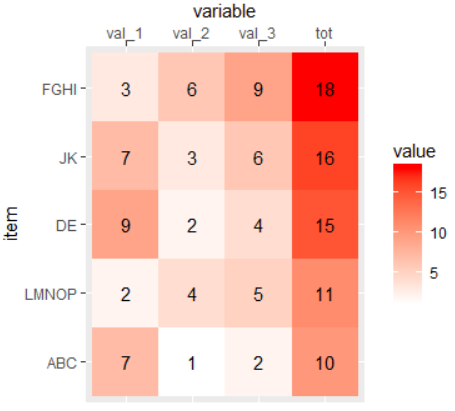
data <- data.frame(
item = c('ABC', 'DE', 'FGHI', 'JK', 'LMNOP'),
val_1 = c( 7 , 9 , 3 , 7 , 2),
val_2 = c( 1 , 2 , 6 , 3 , 4),
val_3 = c( 2 , 4 , 9 , 6 , 5)
);
data$tot = data$val_1 + data$val_2 + data$val_3;
data$item <- reorder(data$item, data$tot);
data.molten = melt(data);
ggplot(
data = data.molten,
aes(x = variable, y = item )) +
geom_tile(aes(fill = value)) +
geom_text(aes(label = value)) +
scale_fill_gradient(low='white', high='red') +
scale_x_discrete(position = 'top');