A line graph is very similar to a scatter plot, yet, instead of drawing dots in connects them with a smoot line.
In R, this can be achieved, for example, with plot and the argument type="l".
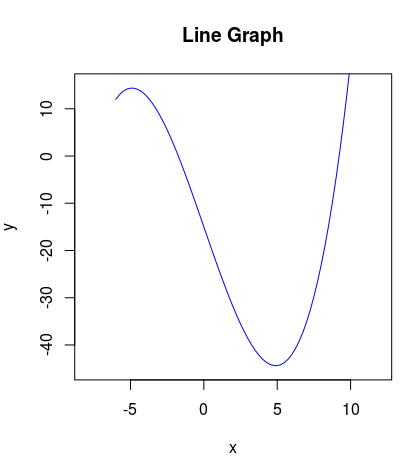
The following is mostly a copy paste of this example, yet with using type="l" instead of type="p":
x11()

x <- seq(-6, 10, by=0.25) # c(-6:10)
y <- x*x*x/8 - 9*x -15

x11()

plot(x, y,
    type="l"         , # Type = "l" --> line graph
    main="Line Graph", # Title
    xlim=c(-8,12)    , # range for x
    ylim=c(-45,15)   , # range for y
    col ="blue"      , # color
 )

# wait for mouse click or enter pressed
z <- locator(1)