A most simple example
The most important R function to create a histogram is
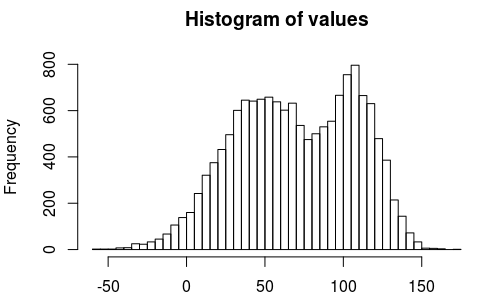
hist: x11()
set.seed(280872)
values <- c(rnorm(10000, 50, 30),
rnorm( 5000,110, 15))
hist(values)
# wait for mouse click or enter pressed
z <- locator(1)
Github repository about-r, path: /graphics/data-visualization/histogram/simple.R
You might want to decorate the output with a title and labels.