x11()
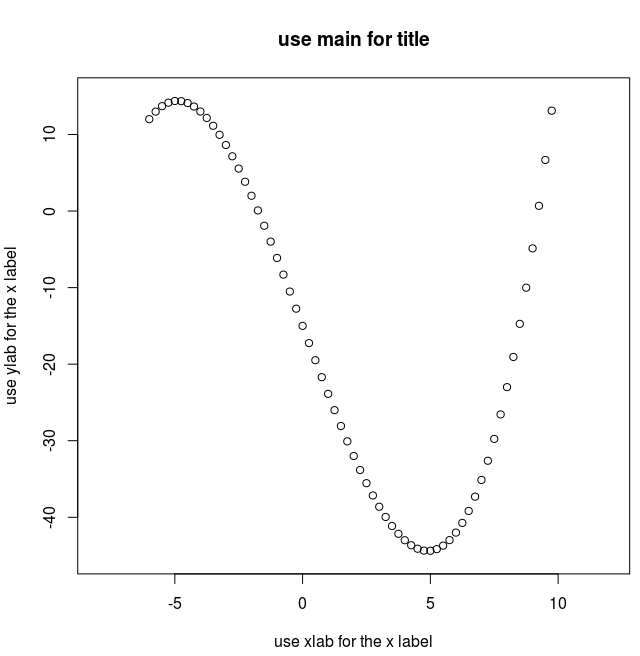
x <- seq(-6, 10, by=0.25) # c(-6:10)
y <- x*x*x/8 - 9*x -15
x11()
plot(x, y,
main="use main for title" ,
xlab="use xlab for the x label",
ylab="use ylab for the x label",
xlim=c(-8,12) ,
ylim=c(-45,15) ,
)
z <- locator(1) # wait for mouse click or enter pressed