Creating test data
#
# https://stackoverflow.com/a/4877936/180275
#
library(ggplot2 )
require(reshape2)
set.seed(2808);
nofObs <- 15;
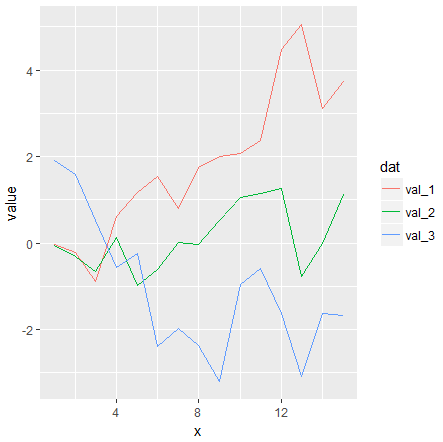
test.data <- data.frame(
x = 1:nofObs ,
val_1 = cumsum(rnorm(nofObs)),
val_2 = cumsum(rnorm(nofObs)),
val_3 = cumsum(rnorm(nofObs))
)
#
# melt data frame so that it looks something like
#
# x dat value
# --------------------
# 1 val_1 1.9203381
# 2 val_1 1.5782440
# 3 val_1 0.5306273
# …
# 1 val_2 -0.9640162
# …
#
test.data.narrow <- melt(
test.data ,
id.vars = 'x',
variable.name = 'dat'
)
ggplot(
test.data.narrow,
aes(
x = x,
y = value)
) +
geom_line(
aes(colour = dat)
)
Github repository about-r, path: /functions/cumsum/create-test-data.R
See also ggplot2.