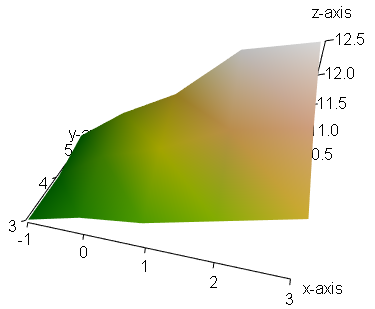
The following script is the result of an attempt of mine to get more clarity on rgl's coordinate system and how it displays axes.
library(rgl)

#
#  Specify some z-values in an x/y coordinate
#  system:
#
   z <-
#     -1    0    1    2    3
#  ----------------------------
  c(   1 ,  3 ,  4 ,  6 ,  8 , # 3
       1 ,  5 ,  7 , 10 , 11 , # 4
       2 ,  6 ,  9 , 14 , 15   # 5
  )

#
#  Explicitly store the range of the
#  x and y coordinates:
#
   x <- -1:3
   y <-  3:5

#
#  Flatten the z values:

   z = z/6 + 10

#
#  Use matrix() to print the z-values in a grid:
#
   matrix(z, nrow = length(y), byrow = TRUE)
#
#          [,1]     [,2]     [,3]     [,4]     [,5]
# [1,] 10.16667 10.50000 10.66667 11.00000 11.33333
# [2,] 10.16667 10.83333 11.16667 11.66667 11.83333
# [3,] 10.33333 11.00000 11.50000 12.33333 12.50000


   nof_colors <- 10
#
#  z_to_color = heat.colors   (nof_colors)
   z_to_color = terrain.colors(nof_colors)
#
#  Assign a color for each cell in the grid
#  depending on its z value.
#  The function cut() comes in handy to
#  distribute the (fractional) z values to
#  nof_colors evenly sized intervals:
#
   cell_color = z_to_color[ cut(z, nof_colors) ]

#
#  Finally: plot the surface
#
   surface3d(
     x     =   x,
     y     =   y,
     z     =   z,
     col   = cell_color,
     back  = c('lines')
   )

#
#  Add x, y and z axes.
#  The x and y axes start in the origin (0, 0, 0)
#  The z axis uses two plus signs so that it starts on
#  the «opposite» end:
#
   axis3d ('x'  , nticks = length(x)-1)
   axes3d ('y'  , nticks = length(y)-1) # Why do I need to subtract 1 here?
   axis3d ('z++', nticks = 4)

#
#  Label the exes:
#
   mtext3d('x-axis', 'x'  , at= max(x) + 0.4)
   mtext3d('y-axis', 'y'  , at= max(y) + 0.4)
   mtext3d('z-axis', 'z++', at= max(z) + 0.4)

#
#  Adjust the view on the plot:
#  The values of the matrix were determined with
#     par3d()$userMatrix
#
   view3d(
     userMatrix = matrix(
        c(
           0.9567 ,  0.2809 , -0.0753 , 0 ,
          -0.1213 ,  0.6208 ,  0.7744 , 0 ,
           0.2643 , -0.7318 ,  0.6281 , 0 ,
           0.0000 ,  0.0000 ,  0.0000 , 1
         ),
         nrow  = 4,
         byrow = TRUE
       )
   )
#
#  Resize the plot
#
   par3d(windowRect = c(100, 100, 700, 500))