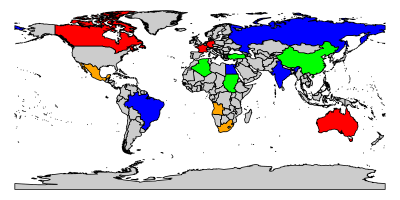
Highlighting some countries
The following example highlights some randomly chosen countries with different colors.
X11()

library(maptools)
data(wrld_simpl)

#
# Create a named vector with the color for each
# country. Initially, all colors are set to
# grey.
#
colorForCountries <- setNames(
            rep(gray(0.8), nrow(wrld_simpl@data)),
            wrld_simpl@data$NAME
          )

#
# Change the colors of some randomly chosen countries.
#
colorForCountries[wrld_simpl@data$NAME %in% c('Australia', 'France', 'Germany', 'Canada')] = 'red'
colorForCountries[wrld_simpl@data$NAME %in% c('India', 'Russia', 'Egypt', 'Brazil'      )] = 'blue'
colorForCountries[wrld_simpl@data$NAME %in% c('China', 'Algeria', 'Turkey', 'Sudan'     )] = 'green'
colorForCountries[wrld_simpl@data$NAME %in% c('Angola', 'South Africa', 'Mexico'        )] = 'orange'

#
# Finally, create the map.
#
# png('img/highlight-some-countries.png', width=400, height=200)
par(mar=rep(0, 4))
plot(
    wrld_simpl,
    col = colorForCountries
)

cat("Press <Enter> to continue...")
invisible(readLines(file("stdin"), 1))
Github repository about-r, path: /packages/maptools/highlight-some-countries.R