Showing hierarchical relations
With
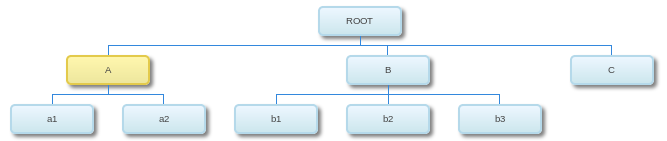
gvisOrgChart it's possible to show hierarchical relations (which are essentially directed acyclic graphs). #
# Apparently, this script cannot be run as a batch.
# It rather needs to be sourced:
#
# source('gvisOrgChart.R')
#
suppressPackageStartupMessages(library(googleVis))
hierarchicalData = read.table(
sep = ',' ,
header = TRUE ,
na.strings = 'null', # Treat string »null« as NA
text =
'name,nameParent,val
ROOT,null,43
A,ROOT,18
B,ROOT,22
C,ROOT,17
a1,A,19
a2,A,7
b1,B,25
b2,B,37
b3,B,55'
)
hierarchicalChart <- gvisOrgChart(
hierarchicalData ,
idvar ='name' ,
parentvar ='nameParent',
options = list(
allowCollapse = TRUE
)
)
plot(hierarchicalChart)
Github repository about-r, path: /packages/googleVis/gvisOrgChart.R