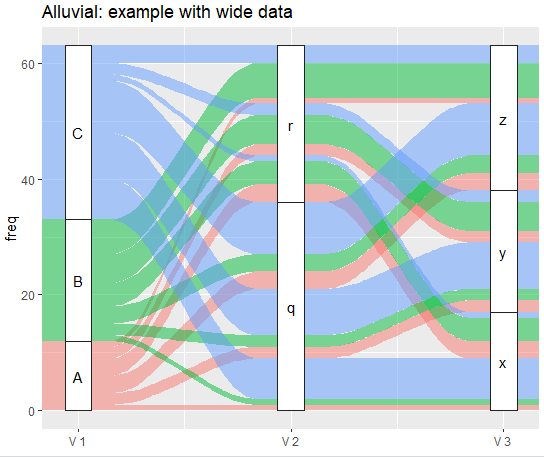
Wide format
The data to be displayed can be in a data frame with wide format where one row is stored per alluvium.
library(ggalluvial)

data <- data.frame (
   v_1  = c('A', 'A', 'A', 'A', 'A', 'A', 'B', 'B', 'B', 'B', 'B', 'B', 'C', 'C', 'C', 'C', 'C', 'C'),
   v_2  = c('q', 'q', 'q', 'r', 'r', 'r', 'q', 'q', 'q', 'r', 'r', 'r', 'q', 'q', 'q', 'r', 'r', 'r'),
   v_3  = c('x', 'y', 'z', 'x', 'y', 'z', 'x', 'y', 'z', 'x', 'y', 'z', 'x', 'y', 'z', 'x', 'y', 'z'),
   freq = c( 1 ,  2 ,  3 ,  3 ,  2 ,  1 ,  1 ,  2 ,  3 ,  4 ,  5 ,  6 ,  7 ,  8 ,  9 ,  1 ,  2 ,  3 )
);

ggplot(data,
  aes(y     = freq,
      axis1 = v_1,
      axis2 = v_2,
      axis3 = v_3
  )
) + geom_alluvium(
      aes(fill = v_1),
#     width        =  0,
#     knot.pos     =  0,
      reverse      =  FALSE
) + guides(
      fill         =  FALSE
) + geom_stratum(
      width        =  1/8  ,
      reverse      =  FALSE,
      color        = '#222222'
) + geom_text(
      stat         = 'stratum',
      label.strata =  TRUE,
      reverse      =  FALSE
) + scale_x_continuous(
      breaks       =  1:3,
      labels       =  c('V 1', 'V 2', 'V 3')
#) + coord_flip(                                 # Uncomment to plot from bottom to top
) + ggtitle('Alluvial: example with wide data'
)
Github repository about-r, path: /packages/ggalluvial/wide-format.R