Note: in the following example, grid is first called and points afterwards in order to not overpaint the grid with the points:
x11()
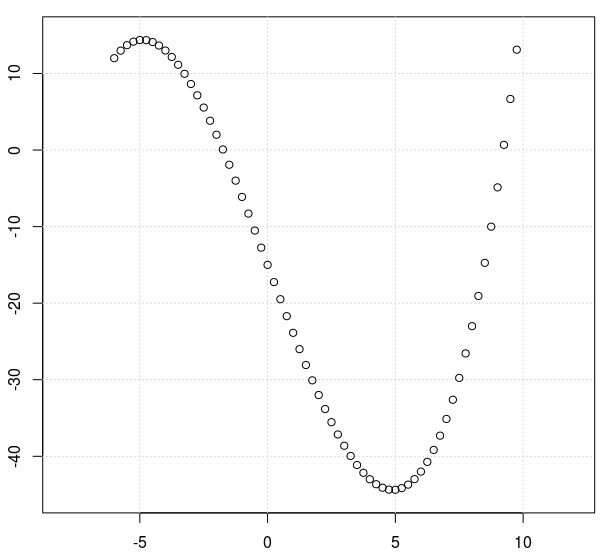
x <- seq(-6, 10, by=0.25) # c(-6:10)
y <- x*x*x/8 - 9*x -15
x11()
plot(
c(), c(), # Empty set, points will be drawn later …
type = "n", # start new plot, but don't add data
xlim=c(-8,12) ,
ylim=c(-45,15) ,
)
grid()
# Call points again so that points that were drawn over by grid are
# painted »above« the grid:
points(x, y)
# wait for mouse click or enter pressed:
z <- locator(1)