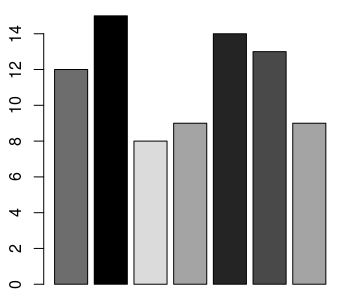
gray it's possible to create a palette of gray shades and then to apply the colors to the graphic. x11() heights <- c( 12, 15, 8, 9, 14, 13, 9 ) relative_heights = rank(heights) / length(heights) gray_shades = grey(1 - relative_heights) barplot(heights, col=gray_shades) # wait for mouse click or enter pressed z <- locator(1)