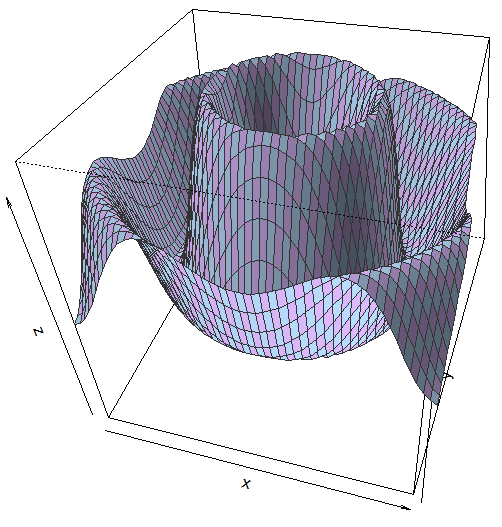
Simple example
x <- y <- seq(-10, 10, length = 50);

z <- outer(x, y,
       function(x,y) {
         r <- sqrt(x^2 + y^2)+3;
         sin(r)/r
       });

persp(x, y, z,
   theta  = 15,        # Rotation about z-axis, in degrees
   phi    = 40,        # Rotation about x-axis, in degrees
   expand =  1,        # Shrinking/growing of z values
   border = '#333333',
   col    = c('#bbddff', '#ddbbff'),
   shade  =  0.2
);
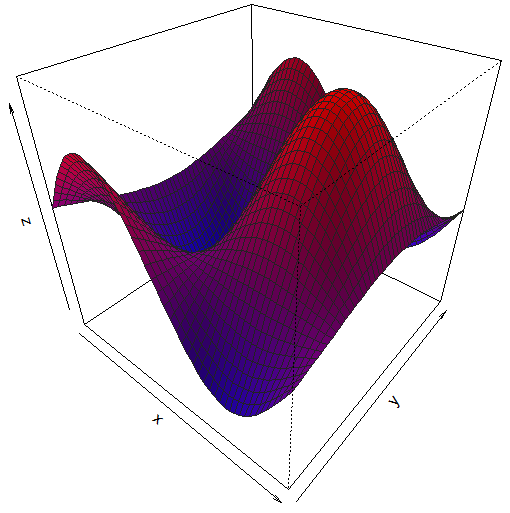
Coloring the highs and lows
This example is very similar to the last one but uses
colorRampPalette to create a palette that is then used to color the high and low values in the graphic differently:
x <- y <- seq(-10, 10, length = 50);

z <- outer(x, y,
       function(x,y) {
         0.3*sin(0.3*x) * 0.4*cos(0.23*y)
       });

nofColors <- 100;
colorFunc <- colorRampPalette(c('blue', 'red'));
colors_   <- colorFunc(nofColors); # Use underscore because identifier colors already taken.

#
# Assign value of each facet's center coordinates to z.centerValues.
#
# The minus excludes the respective row and column in the matrix, resulting in a matrix
# that has one row and column less than that of z.
#
z.centerValues <- (
   z[      -1  ,      -1  ] +
   z[      -1  , -ncol(z) ] +
   z[ -nrow(z) ,      -1  ] +
   z[ -nrow(z) , -ncol(z) ]
) / 4;

z.colorBin <- cut(z.centerValues, nofColors);

persp(x, y, z,
   theta  = 40,        # Rotation about z-axis, in degrees
   phi    = 35,        # Rotation about x-axis, in degrees
   expand =  1,        # Shrinking/growing of z values
   border = '#222222',
   col    =  colors_[z.colorBin],
   shade  =  0.2
);
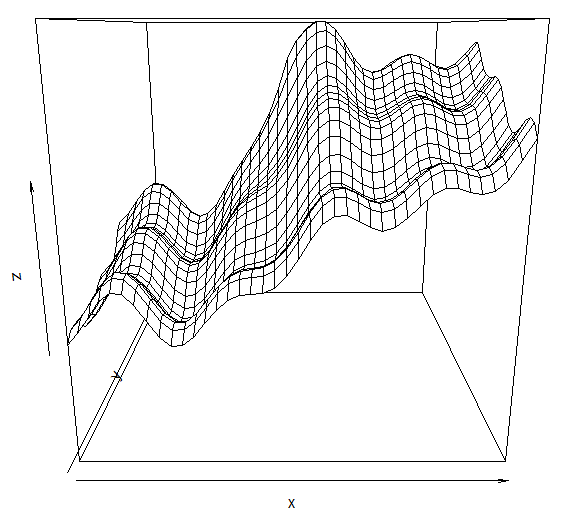
Using matrix
This is an old example. I am not sure anymore why I used the
matrix function.
x11()

x <- seq(-10, 10, length=40)
y <- seq(-10, 10, length=40)

z <- matrix (
  outer(x, y,
        function(x, y) {
          14 -
          sqrt( (x+cos(y)/10) ^2 + (y - sin(x)/5) ^2) +
          cos((x-2)/3)*sin(x) +
          cos((y-2)/4)*cos(y) +
        #
          sqrt( (x+3) ^ 2 + (y/2-2) ^2)
        }
  ),
  nrow=length(x)
)

persp(x, y, z)

locator(1)