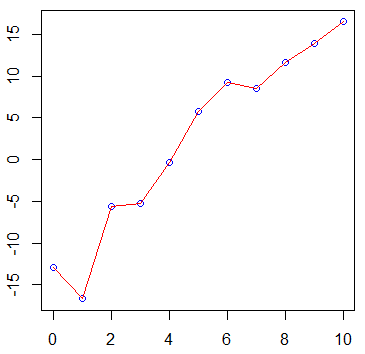
x11()

set.seed(280870)

x <- 0:10
y <- x*3 - 12 + rnorm(length(x), 0, 3)

plot (x, y, col=4)
lines(x, y, col=2)

# wait for mouse click or enter pressed
z <- locator(1)
Index