Search notes:
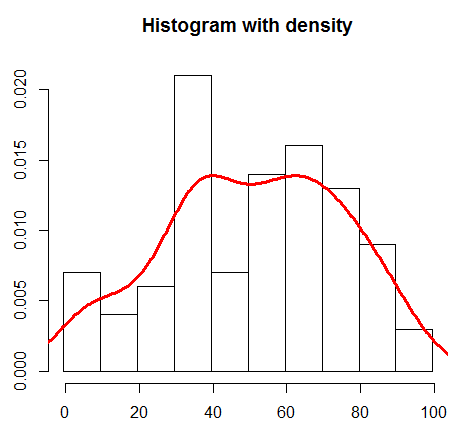
R function: density
x11()

d_100 <- c(
                 35,
                 37,
                 38,
                 30,
                 36,
                 35,         69,
                 34,         62,
                 32,     50, 64,
                 39,     57, 66, 72,
                 37,     50, 69, 78,
                 39,     58, 60, 72,
                 38,     52, 63, 76,
                 30,     55, 68, 77, 84,
                 32,     51, 68, 74, 83,
      8,         38, 41, 56, 62, 73, 89,
      9,     26, 35, 40, 52, 64, 73, 82,
      0,     23, 39, 47, 52, 60, 77, 82,
      6, 10, 22, 35, 47, 50, 63, 70, 82,
      7, 12, 23, 38, 44, 51, 61, 72, 87, 99,
      4, 15, 24, 39, 47, 56, 63, 71, 89, 91,
      1, 17, 27, 33, 45, 58, 63, 79, 86, 92
)

hist(
  d_100,
  breaks=seq(0,100,by=10)-0.5,
  freq=FALSE,
  main='Histogram with density',
  xlab='',
  ylab='')

dens = density(d_100)#, bw="SJ")

lines(dens, col='red', lwd=3)

# wait for mouse click or enter pressed
z <- locator(1)