Search notes:

R probability distribution functions: prefix

Most (all?) R probability functions come with four prefixes: r, p, d, q.

r - random deviates

set.seed(26);

mean_ <- 100
sd_   <-   5;

#
#  Generaate 10000 normal distributed values
#
n <- rnorm(10000, mean_, sd_);

from_ <-  80;
to_   <- 120;
breaks_ <- seq(from_, to_, by = 1);

#
#  Plot the values' frequency
#
# par(mar = c(2,2,0,0));
par(mar = c(2.5, 2.5, 0.5, 0.5));

hist_ <- hist(n,
     breaks =  breaks_,
     col    ='#ffdca9',
     main   =  NULL
);
Github repository about-r, path: /functions/_probability-distribution/_prefix/r.R

d - density

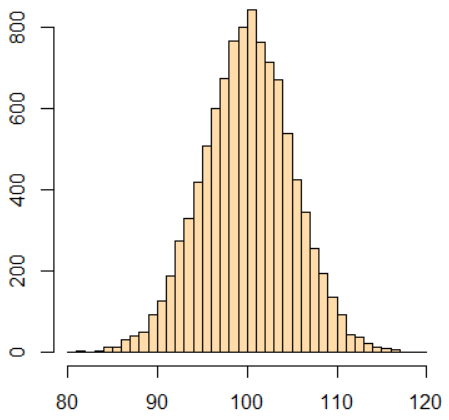
The d prefix stands for the probability density function (PDF).
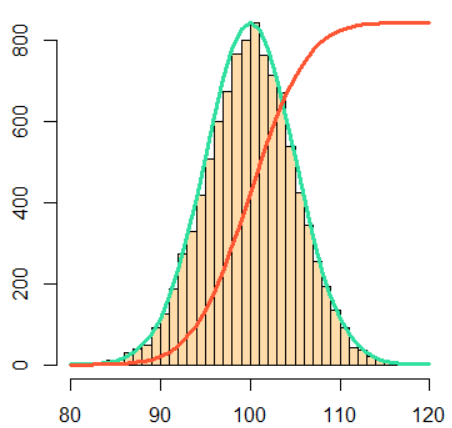
The PDF is added onto the plot, showing that the shape of the histogram tends to converge to the shape of the PDF as the number of random variables increases.
dens <- dnorm(breaks_, mean_, sd_);

lines(
    breaks_            ,
    dens / max(dens) * max(hist_$counts),
    col='#30e0a0',
    lwd = 3
);
Github repository about-r, path: /functions/_probability-distribution/_prefix/d.R

p

The p prefix stands for the Cumulative Distribution Function (CDF).
We add the CDF onto the plot with a big fat red line:
cdf <- pnorm(breaks_, mean_, sd_);

lines(
    breaks_                ,
    cdf * max(hist_$counts),
    col ='#ff5533'         ,
    lwd = 3
);
Github repository about-r, path: /functions/_probability-distribution/_prefix/p.R

q - quantile function

prob  <- seq(0, 1, by=0.01);
quant <- qnorm(prob , mean_, sd_);

plot(
     prob            ,
     quant           ,
     type  = 'l'     ,
     lwd   =  3      ,
     col   ='#5533ff'
);
Github repository about-r, path: /functions/_probability-distribution/_prefix/q.R

Index