Search notes:

Perl module GD::Graph::bars

GD::Graph::bars allows to draw bar charts with Perl.

script.pl

#!/usr/bin/perl
use warnings;
use strict;

use GD::Graph::bars;
use GD::Graph::Data;

my $data = GD::Graph::Data->new([
  [qw /Jan Feb Mar Apr May Jun Jul Aug Sep Oct Nov Dec/],
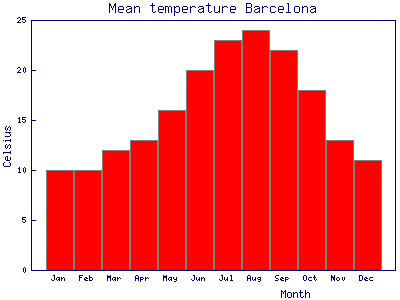
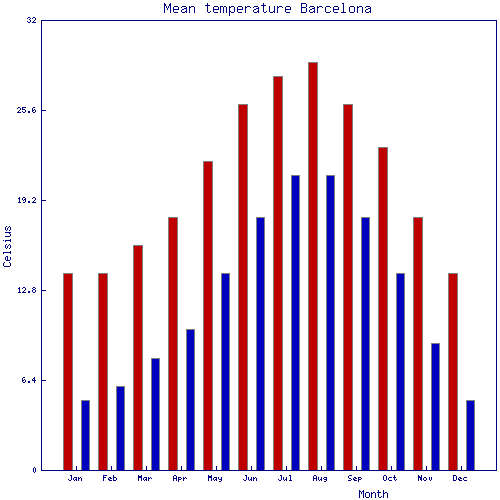
  [     10, 10, 12, 13, 16, 20, 23, 24, 22, 18, 13, 11 ], # Mean Temperature Barcelona
]);

my $graph = GD::Graph::bars->new;

$graph -> set (

    x_label    => 'Month',
    y_label    => 'Celsius',
    title      => 'Mean temperature Barcelona'

);

$graph->plot($data);

open my $png, '>', 'Temperature-Barcelona.png';
binmode $png;
print $png $graph->gd->png;
close $png;
Github repository PerlModules, path: /GD/Graph/bars/script.pl

min_max_temperature.pl

#!/usr/bin/perl
use warnings;
use strict;

use GD::Graph::bars;
use GD::Graph::Data;

my $data = GD::Graph::Data->new([
  [qw /Jan Feb Mar Apr May Jun Jul Aug Sep Oct Nov Dec/],
  [     14, 14, 16, 18, 22, 26, 28, 29, 26, 23, 18, 14 ], # Mean Max Temperature Barcelona
  [      5,  6,  8, 10, 14, 18, 21, 21, 18, 14,  9,  5 ], # Mean Min Temperature Barcelona
]);

my $graph = GD::Graph::bars->new(500, 500);

$graph -> set (

    x_label     => 'Month',
    y_label     => 'Celsius',
    y_max_value =>  32,
    title       => 'Mean temperature Barcelona',
    transparent =>  0,
    bar_spacing =>  8,
    dclrs       => [qw/red blue/]

);

$graph->plot($data);

open my $png, '>', 'Min-Max-Temperature-Barcelona.png';
binmode $png;
print $png $graph->gd->png;
close $png;
Github repository PerlModules, path: /GD/Graph/bars/min_max_temperature.pl

See also

GD::Graph::histogram
Perl modules
Data visualization

Index