Running the script
dtrace -c MessageBox.exe -s trace.d
The script's output shows that it correctly determines the values of the addresses that are passed to
MessageBox: 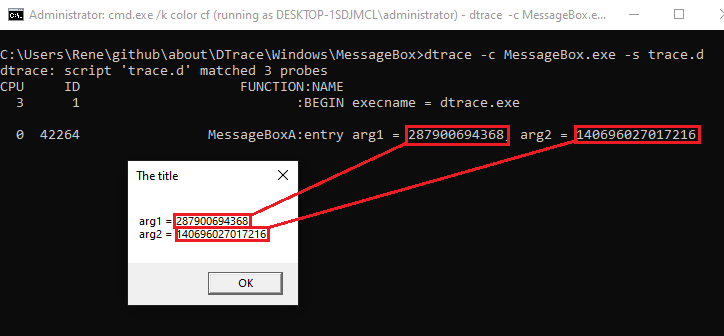
MessageBoxA and ExitProcess. /NODEFAULTLIB and have to specify the entry point with /ENTRY. //
// cl /nologo /W4 /wd4100 /GS- MessageBox.c /link /nodefaultlib /entry:start /subsystem:Windows user32.lib kernel32.lib
//
#include <windows.h>
int start(void* PEB) {
char arg1[100];
char* arg2 = "The title";
wsprintfA(arg1,
"arg1 = %I64d\n"
"arg2 = %I64d" , arg1, arg2);
MessageBoxA(0, arg1, arg2, 0);
ExitProcess(0);
}
MessageBox and prints the addresses of the two string parameters (arg1 and arg2). BEGIN {
printf("execname = %s\n", execname);
}
pid$target:USER32:MessageBoxA:entry
/* /arg2 != 0/ */
{
/*
Did not work!
printf("%s\n", copyinstr(args[1]) );
*/
printf("arg1 = %d, arg2 = %d\n", arg1, arg2);
}
END {}
copyinstr() to printf the string that was passed to the MessageBox. dtrace -c MessageBox.exe -s trace.d
MessageBox: