Horizontal error bars
Horizontal error bars combined with a stacked bar chart allows to create waterfall like charts where its «ranges» are connected:
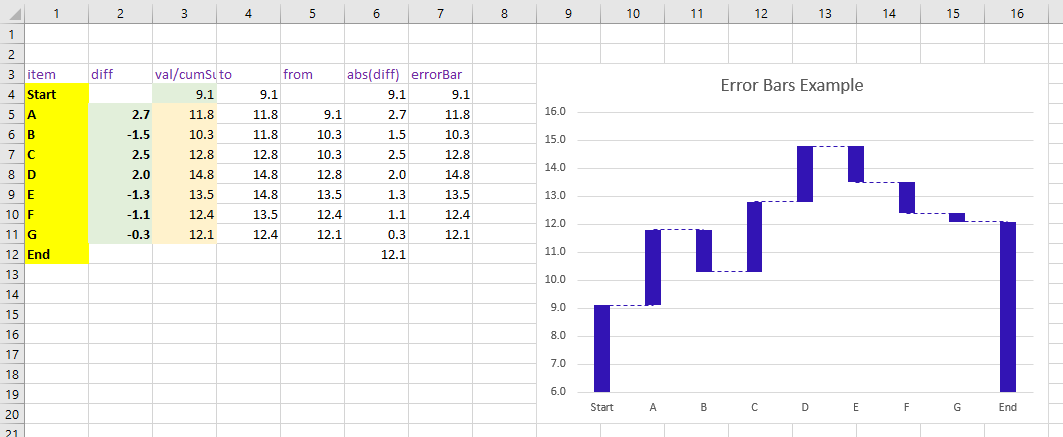
This chart was created with the following VBA program:
option explicit

dim rngLabels   as range

sub main() ' {

    fillData

  '
  '     Although this example is going to create a combo chart,
  '     it starts with a clustered column chart.
  '

    dim rngDest as range
    set rngDest = range(cells(3, 9), cells(20, 16))

    dim sh as shape
    set sh = activeSheet.shapes.addChart2(201, xlColumnClustered, _
        left   := rngDest.left   , _
        top    := rngDest.top    , _
        width  := rngDest.width  , _
        height := rngDest.height )


    dim cht as chart
    set cht = sh.chart

    dim serInvisble as series
    dim serVisible  as series
    dim serScatter  as series

    with cht ' {

         with .seriesCollection ' {

          '
          ' Delete potential series collection so that we
          ' can start with a new set of series.
          '
            while .count > 0 ' {
                  .item(1).delete
            wend ' }

          '
          ' We need two series for the bars, an invisible
          ' one and a visible one:
          '
            set serInvisble = .newSeries
            set serVisible  = .newSeries

          '
          ' We also need a scatter chart series to which
          ' the error bars will be attached:
          '
            set serScatter  = .newSeries

         end with ' }

       '
       ' The xValues range determines the categories of the
       ' series. They're shown below the column:
       '
         serInvisble.xValues = rngLabels

         serInvisble.values    = rngLabels.offset(columnOffset := 4)
         serVisible.values     = rngLabels.offset(columnOffset := 5)
         serScatter.values     = rngLabels.offset(columnoffset := 6)

         serInvisble.chartType = xlColumnStacked
         serVisible.chartType  = xlColumnStacked
         serScatter.chartType  = xlXYScatter

         serInvisble.format.fill.visible      = msoFalse

         serVisible.format.fill.foreColor.rgb = rgb(50, 20, 180)

         serScatter.format.fill.visible = msoFalse
         serScatter.format.line.visible = msoFalse

         serScatter.markerStyle         = xlMarkerStyleNone

       '
       ' The scatter series was not assigned a xValues range, therefore, the
       '(default) distance between them is 1, which is also the value that
       ' is given for the paramter amount
       '
         serScatter.errorBar xlX, xlPlusValues, xlErrorBarTypeCustom, amount := 1

         with serScatter.errorBars ' {

             .endStyle    = xlNoCap

              with .format.line ' {

                   .foreColor.rgb = rgb(50, 20, 180)
                   .dashStyle     = msoLineDash
                   .Weight        = 0.5

              end with ' }

         end with ' }

        .axes(xlValue).minimumScale = 6

       '
       ' Add the title for the chart
       '
        .setElement(msoElementChartTitleAboveChart)
        .chartTitle.text = "Error Bars Example"

    end with ' }

end sub ' }

sub fillData() ' {

    dim rngStartVal as range
    dim rngDiff     as range
    dim rngCumSum   as range
    dim rngTo       as range
    dim rngTo_      as range
    dim rngFrom     as range
    dim rngFrom_    as range
    dim rngErrorBar as range
    dim rngDiffAbs  as range
    dim rngDiffAbs_ as range

  '
  ' The names of the lables (x Values) of the
  ' bars, from top to bottom (on the chart from
  ' left to right)
  '
    set rngLabels   = range( cells(4,1), cells(12,1) )

  '
  ' The cell that stores the first (left most) value:
  '
    set rngStartVal =        cells(4,3)

  '
  ' Reading from top to buttom (on the chart from left
  ' to right), rngDiff stores the difference to the
  ' previous value.
  '
    set rngDiff     = range( cells(5,2), cells(11,2) )

  '
  ' The values in rngCumSum cumulatively sums up the delta
  ' values of rngDiff, thus resulting in «the» value for
  ' a label
  '
  '
    set rngCumSum   = range( cells(5,3), cells(11,3) )
  '
  ' The values in rngTo and rngFrom store the value of the
  ' upper and lower end of the visible part of the stacked bar.
  '
    set rngTo       = rngCumSum.offset(0, 1)
    set rngTo_      = rngTo.offset(-1,0).resize(1,1)
    set rngFrom     = rngTo.offset( 0,1)
    set rngFrom_    = rngTo_.offset(0,1).resize(1,1)
    set rngDiffAbs  = application.union(rngFrom, rngFrom_).offset(0,1)
    set rngDiffAbs_ = rngDiffAbs.offset(rngDiffAbs.rows.count).resize(1,1)
    set rngErrorBar = rngDiffAbs.offset(0,1)

    with range( cells(3,1), cells(3,7)) ' {

        .value      = array( "item", "diff", "val/cumSum", "to", "from", "abs(diff)", "errorBar")
        .font.color = 10498160

    end with ' }

    with rngLabels ' {
        .value = worksheetFunction.transpose(array("Start", "A", "B", "C", "D", "E", "F", "G", "End"))
        .font.bold      = true
        .interior.color = rgb(255, 255, 0) ' Yellow
    end with ' }

    with rngStartVal ' {
        .value = 9.1
        .numberFormat   = "0.0"
        .interior.color =  14348258        ' Greenish
    end with ' }

    rngTo_.value = rngStartVal.value

    with rngDiff ' {
        .value = worksheetFunction.transpose(array(2.7, -1.5, 2.5, 2.0, -1.3, -1.1, -0.3))
        .font.bold      =  true
        .interior.color =  14348258        ' Greenish
    end with ' }

    with rngCumSum ' {
        .formulaR1C1    = "= r[-1]c + rc[-1]"
        .interior.color =  13431551
    end with ' }

    with rngTo ' {
      .formulaR1C1      = "= max(  r[-1]c[-1]:rc[-1] )"
    end with ' }

    with rngFrom ' {
      .formulaR1C1      = "= min( rc[-2]:r[-1]c[-2]  )"
    end with ' }

    with rngDiffAbs ' {
        .formulaR1C1    = "= rC[-2] - rc[-1]"
    end with ' }

    with rngDiffAbs_ ' {
        .formulaR1C1    = "= r[-1]c[-1]"
    end with ' }

    with rngErrorBar ' {
        .formulaR1C1    = "= rc[-4]"
    end with ' }

    with application.union(rngStartVal, rngDiff, rngCumSum, rngTo, rngTo_, rngFrom, rngFrom_, rngDiffAbs, rngDiffAbs_, rngErrorBar) ' {
        .numberFormat = "0.0"
    end with ' }

end sub ' }
Github repository about-MS-Office-object-model, path: /Excel/ErrorBars/horizontal-for-waterfall-like-charts.bas