Source code
option explicit
sub main() ' {
speedUp
dim chart_ as chart
set chart_ = createChart
call chart_.export(fileName := environ("temp") & "\export.png", filterName := "png")
slowDown
end sub ' }
private function createChart() as chart ' {
dim row_ as integer
dim chart_ as chart
row_ = 1
cells(1,1).value = "x"
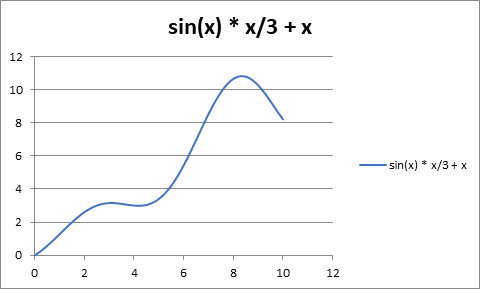
cells(1,2).value = "sin(x) * x/3 + x"
dim x as double
for x = 0 to 10 step 0.1 ' {
row_ = row_ + 1
cells(row_, 1).value = x
cells(row_, 2).value = sin(x) * x / 3 + x
next x ' }
dim shape_ as shape
set shape_ = activeSheet.shapes.addChart
set createChart = shape_.chart
createChart.chartType = xlXYScatterSmoothNoMarkers
createChart.setSourceData source := range(cells(1,1), cells(row_, 2))
end function ' }
private sub speedUp() ' {
application.screenUpdating = false
application.calculation = xlCalculationManual
application.enableEvents = false
application.displayStatusBar = false
end sub ' }
private sub slowDown() ' {
application.screenUpdating = true
application.calculation = xlCalculationAutomatic
application.enableEvents = true
application.displayStatusBar = true
end sub ' }