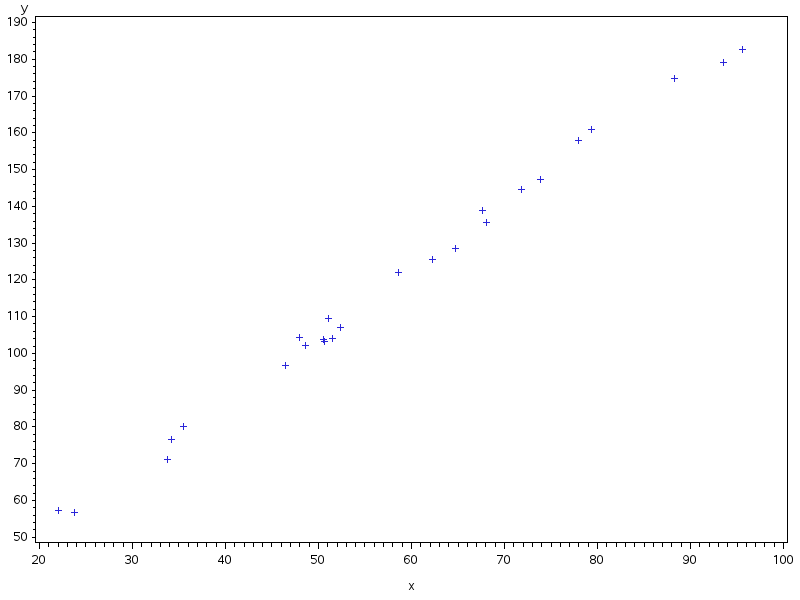
Simple example
data tq84_dat;
  do i = 1 to 25;
     x = 50 + 20 * rand('norm');
     y = 10 + x * 1.8 + rand('unif') * 8;
     output;
  end;
run;

filename graph '/share/home/tq84/sas/img/gplot.png';

goptions
  reset   = all
  device  = png
  gsfname = graph;

proc gplot data = tq84_dat;
     plot y * x; /* Note: the y axis comes first */
run;
Github repository about-SAS, path: /programming/proc/gplot/basic.sas